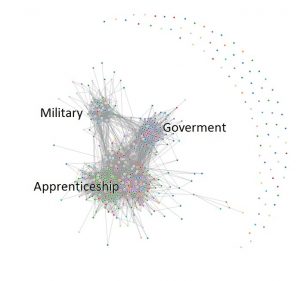
Using socilab I created a visual representation of my LinkedIn social network. Insights I gained from this activity are that my professional networks differ greatly from my use of other social platforms which I tend to reserve for close family and dear friends. Three distinct main clusters are graphically illustrated in this graphic representation. The largest cluster of professional connections in my network is generated from working as a trade instructor. They include students, peers, and trades-persons I have interacted with over a 10 year span. The next cluster is representative of my 20 year military career. The third is newer connections generated through a 2 year position as a bureaucrat in Alberta.
Surprising is the size of these clusters do not correlate to my time spent in a particular vocation or industry. Other leanings I get from the graphic are the outliers that lack connections; they are potential links to new clusters. Challenges how me are to how to produce engaging content that would appeal to each cluster.
Leave a Reply