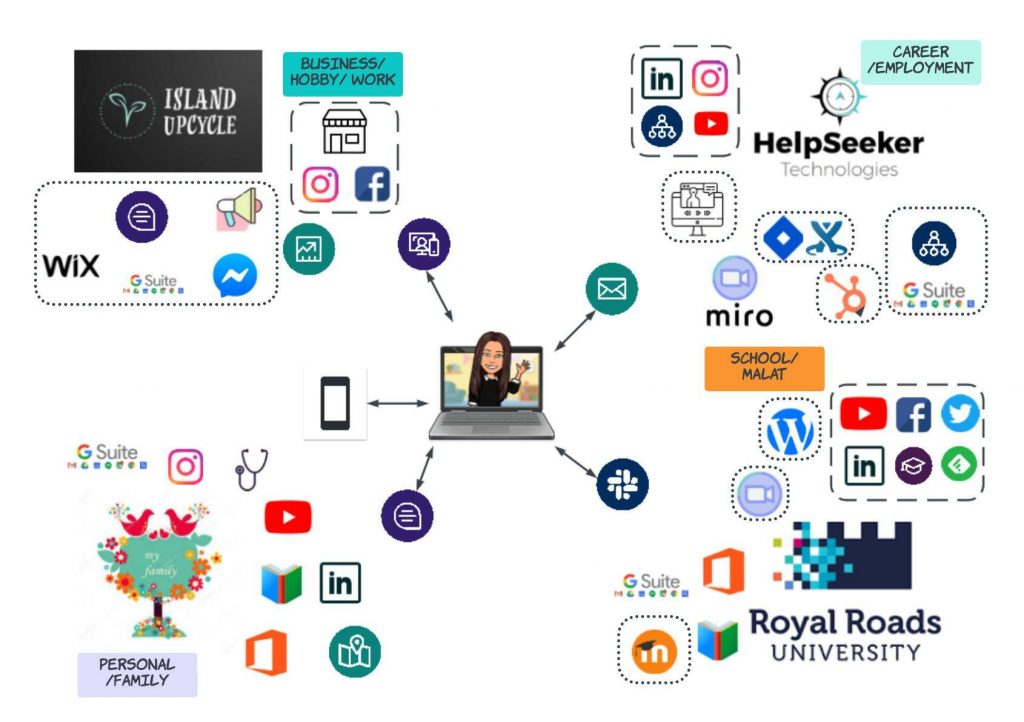
This visual network map is a merge of my where I want my digital presence to be and what I currently understand to make up my online world are reflected in a cultivated map of carefully organized tools and technologies that together make up a cohesive interrelated web of relationships and platforms where information is created and consumed.
I have used a dotted outline to identify the different learning management systems and tools together that satisfy Dron and Anderson’s (2009), example of groups, where “participants know each other and their entry to and exit from the group are con-trolled” (Dron & Anderson, 2014), examples of groups for myself include WordPress, virtual meeting platforms, webinars and other gated groups such as steering committees and team sprints. In addition, I have an online presence with a group of sellers and purchasers that I market, respond, and sell to.
Reflected by a perforated line are networks, which oppose to communities as Dron & Anderson (2014), contrast is “relatively loose”, these can be seen on my ‘Visual Network Map’ as social media and selling platforms. The outside corners speak to the communities that “exhibit commitment, coherence, and continuity” (Dron & Anderson, 2014) and reflect my business, career, my personal digital relationships and the MALAT program. The upper axis furthermore represents the landscape in where content is created, and my technology skills are rewarded. The bottom two corners reflect a space where I heavily consume content and work to build and solidify relationships with technology while creating a healthy online digital self.
References
Dron, J., & Anderson, T. (2014). Teaching crowds : Learning and social media. Athabasca University Press.
Recent Comments