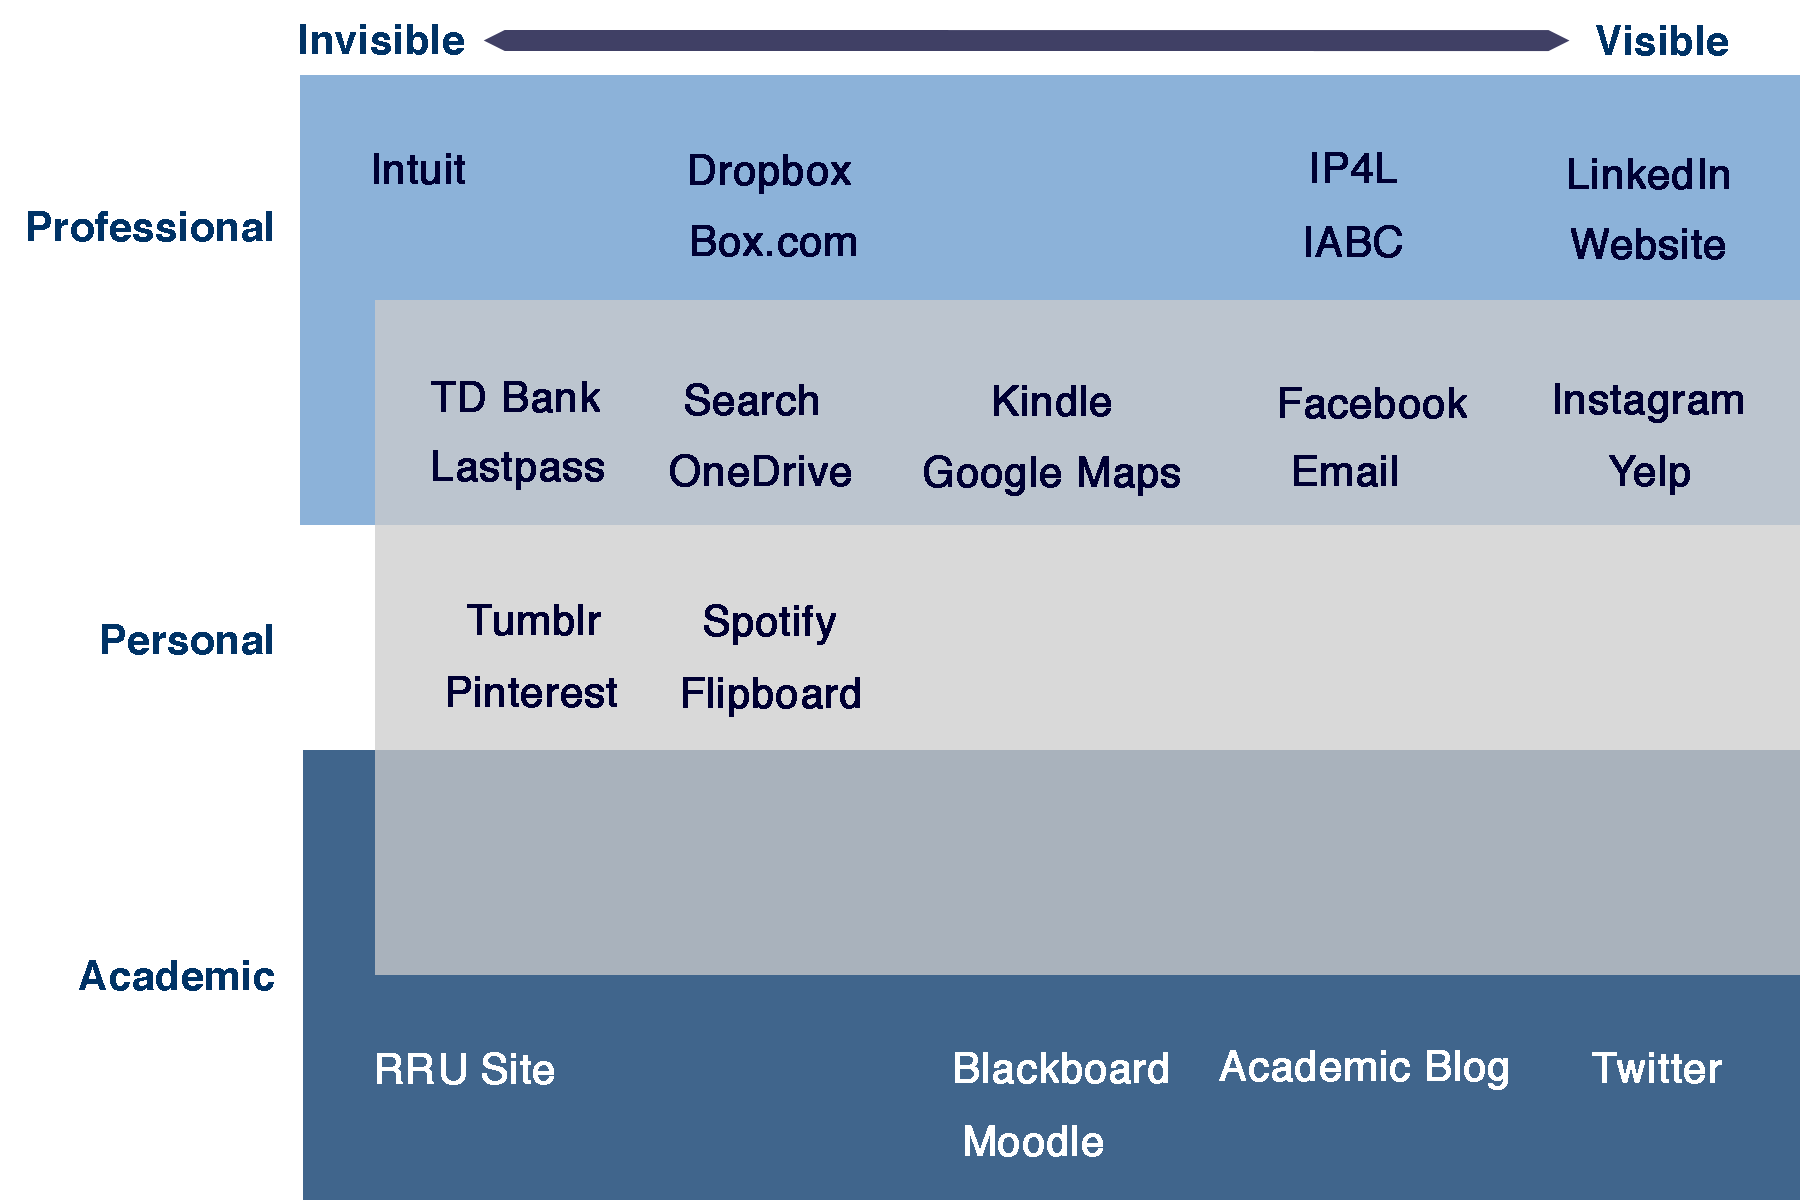
Adapting the concept of a resident/visitor typology, I created this map to illustrate my current digital presence and how I engage with others online.
Visible or invisible?
The top displays a continuum between how visible or invisible I am to other internet users when I am present or accessing digital spaces.
Invisible: Most of the tools I access in a digital environment involve little engagement with others and do not leave much of a digital footprint. The main reason for this is to protect personal, business, and financial data.
Visible: I am visible on my LinkedIn profile, business website, Instagram account, and Yelp reviews, all of which were created intentionally for public viewing. Twitter is the newest addition to this mix and is an experiment as part of my master’s program; right now I am more of a consumer of information on Twitter than I am a creator.
In between: The tools and sites shown in the middle of the invisible-visible spectrum are those where I engage with others who I know and trust. These digital spaces are not publicly accessible; they can only be accessed with my permission.
Personal, professional, or academic?
Along the left-hand column, I have identified three main areas of my life where I engage online, in professional, personal, and academic settings.
Professional, personal, and academic dimensions overlap in some cases, where digital spaces are used for multiple purposes. I suspect this would perhaps more true for me than for others since I work for myself. Right now there is very little overlap with the digital spaces in my academic life and the other areas. I will be interested to see how this evolves as I get further into my studies.
Hello Amber,
The clarity of your diagram is stunning. I like the way you set the criteria, and the overlapping areas perfectly convey the message which you explain further in the text. And the lay out of the text information is friendly to the eye, and flows nicely making the content easy to follow. Excellent job!
Cheers!
Alfonso